SBA & USDA Lending Data and Market Intelligence
Nevada Feasibility Study Consultants & Market Data
Nevada's average SBA 7(a) loan runs $554,164, about 25 percent above the national figure, and the state has grown past 3.3 million residents inside an economy anchored by a $79 billion tourism sector and a fast-diversifying manufacturing base. Loan Analytics publishes the lending tables, county demographics, and CRE market metrics behind numbers like these, and prepares independent feasibility studies for SBA 7(a), SBA 504, and USDA projects across Nevada when lenders require the full report.

SBA Lending in Nevada: The Current Numbers

Nevada lenders closed 838 SBA 7(a) loans worth $464.4 million in FY2024, and the average loan of $554,164 ran roughly 25 percent above the national figure of $443,097. That above-average loan size reflects a borrower base weighted toward the hospitality, gaming-adjacent, and service businesses of the Las Vegas Valley, alongside the commercial real estate and franchise transactions that move through one of the most entrepreneur-friendly tax climates in the country.
The national program sets the backdrop. SBA approvals reached a record in FY2025 at roughly 84,400 loans and $44.8 billion, after the agency guaranteed 70,242 7(a) loans worth $31.1 billion in FY2024. Nevada's concentration in Clark and Washoe counties means lending activity tracks closely to the two metropolitan economies, while the state's diversification push into manufacturing, logistics, and technology is steadily broadening the borrower base beyond tourism.
Higher national volume means busier credit desks and closer scrutiny of borrower projections, which is precisely where independent market data and third-party feasibility studies earn their place in the file. Loan Analytics maintains county-level lending and demographic detail for Nevada behind every figure cited here.
Where Nevada Is Growing: County Demographics
Nevada reached an estimated 3.32 million residents in 2025, adding roughly 53,000 people for a 1.6 percent gain, with growth driven primarily by net migration rather than natural increase. Clark County, home to the Las Vegas metropolitan area, holds about 73 percent of the state's residents and captured close to 79 percent of recent population gains, reaching an estimated 2.45 million. Washoe County, anchored by Reno and Sparks, holds about 15 percent of the state at roughly 507,000 residents and continues to draw migration from California. The remaining fifteen rural counties together hold less than 12 percent of the population.
The longer arc matters as much as the single year. State and university projections carry Clark County past 2.6 million by 2030 and toward 3 million by the mid-2040s, with migration from higher-cost states a persistent driver. For a feasibility study, these trajectories are the raw material of demand: trade-area population, household formation, and absorption assumptions all stand or fall on county-level growth, and lenders increasingly test borrower projections against independent figures.

Nevada Commercial Real Estate: The Five Major Markets
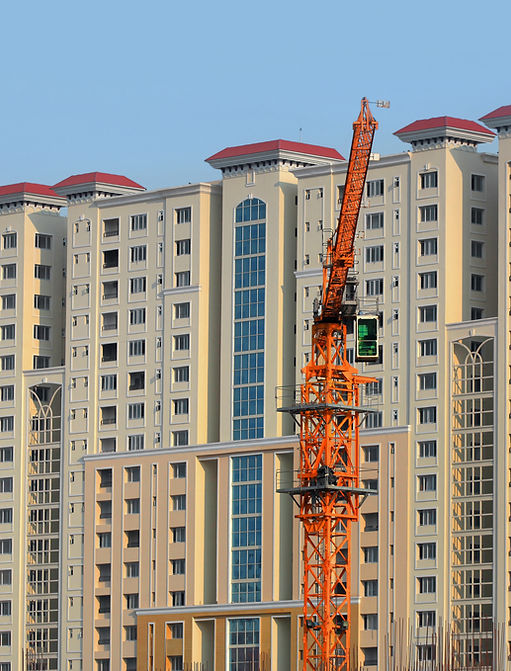
Industrial is the swing story. The Las Vegas market posted overall vacancy of roughly 8.8 percent in the first quarter of 2026, its second consecutive quarterly improvement, as about 530,000 square feet delivered with roughly a fifth preleased at completion. Vacancy remains above historical norms, but the steady downward movement points to a market absorbing its elevated supply rather than softening further, supported by port-adjacent and last-mile logistics demand. Multifamily is holding firm: Southern Nevada vacancy stood near 5.9 percent in the first quarter, slightly tighter than a year earlier, with average asking rents around $1,465 per unit and roughly 6,100 units under construction.
The other three sectors complete the spread. Office strengthened to roughly 12.0 percent vacancy in the first quarter of 2026, its lowest level since late 2023, on a flight to quality and limited new supply rather than broad demand expansion. Retail ran near 6.1 percent vacancy entering 2026, with availability ticking up modestly year over year. Hospitality is the market's defining engine: Las Vegas drew roughly 38.5 million visitors in 2025, and although visitation slipped from the prior year, Strip gaming revenue set a record near $8.8 billion and statewide gaming approached $15.8 billion, with annual hotel occupancy holding around 80 percent. That divergence between sectors is precisely the question a lender asks a feasibility study to resolve.
Construction Costs: The Regional Picture for Nevada
The Mortenson Construction Cost Index for the first quarter of 2026 put national nonresidential costs up 1.69 percent for the quarter and 6.77 percent year over year. Mortenson does not maintain a Las Vegas index, so the nearest Southwest and Mountain West reads bracket the market: Phoenix rose 1.97 percent in the quarter and 7.05 percent year over year, while Denver ran hotter at 2.44 percent for the quarter and 10.37 percent year over year. For a project budget, that spread is not an abstraction. Hard-cost assumptions flow straight into total project cost, loan sizing, and the debt-service coverage a lender stress-tests, and a market drawing on the same regional labor and materials pool as Phoenix and Denver demands a cost basis checked against current regional indices, not last year's.
What This Means for a Feasibility Study in Nevada
Read the four datasets together and the assignment becomes concrete. Above-average loan sizes set against record national volume mean more Nevada projects are reaching credit committees at larger dollar figures that draw closer review. Growth concentrated in Clark and Washoe counties means a demand case that works on the Las Vegas Valley's edge can look different in Reno or in a rural county. Five CRE sectors pointing in different directions, from a supply-heavy industrial market to a recovering office sector to a tourism economy working through a soft visitation year, mean asset selection, not the Nevada label, drives the outcome. And construction costs moving with the broader Southwest mean a budget assembled last year is already stale. Every line of a pro forma now has a current, checkable number standing behind it, or against it.
The state's investment story sharpens all of it. Tourism and hospitality still anchor the economy at roughly $79 billion in annual activity and 350,000 jobs, even as 2025 visitation softened and gaming revenue set records. At the same time, Nevada's diversification push is reshaping demand: Tesla operates one of the world's largest factories outside Reno, mining tied to lithium and gold contributes billions to state GDP, and mega-projects from a new Las Vegas stadium to the Brightline West high-speed rail are drawing speculative investment. Each of those anchors reshapes trade-area demand, labor demand, and absorption in the markets around it, and none of them shows up in a generic template.
Loan Analytics prepares independent feasibility studies for SBA 7(a), SBA 504, and USDA-financed projects across Nevada, built on the same data published on this page and extended to the subject property: trade-area demographics, competitive supply, demand and absorption, financial projections, and sensitivity testing organized around what credit committees actually review. The study arrives as a third-party document, written for the lender's file. To scope one, use the form below or write to Info@analytics.loan. Include the property type, the county, and the loan program, and we come back with scope and timeline.
Request Scope & Timeline
Nevada Feasibility Study FAQ